The Definitive Geek vs Nerd vs Dork Chart: What the Famous Venn Diagram Actually Proves
 By Alexander Ross
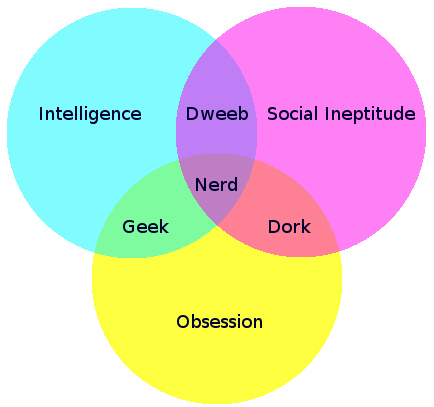
The viral Venn diagram succeeded because it rejected the notion that non-conformists belong to a monolithic social pool. Instead, it introduced three independent personal traits operating simultaneously.
Intelligence represented raw cognitive processing, academic aptitude, or technical proficiency. Obsession measured deep, uncompromising focus on niche interests, from operating system kernels to obscure comic book continuity. Social ineptitude measured an inability or outright refusal to navigate polite social conventions, party talk, and everyday interpersonal rituals.
Isolating these traits resolved decades of playground confusion. A person could possess encyclopedic knowledge of cinema without lacking conversational grace. Another could score perfectly on standard exams while struggling to maintain eye contact. By treating social intelligence as distinct from cognitive traits, the diagram explained why two socially awkward people might have zero common ground.
Alexander Ross has covered the video game industry for a decade, writing deep dives on game design, esports tournaments, VR developments, and gaming culture.
