Beyond the Box Score: Visualizing Statcast Metrics Behind Mlb's Surprise Leaders
 By Maya Lin-Takahashi
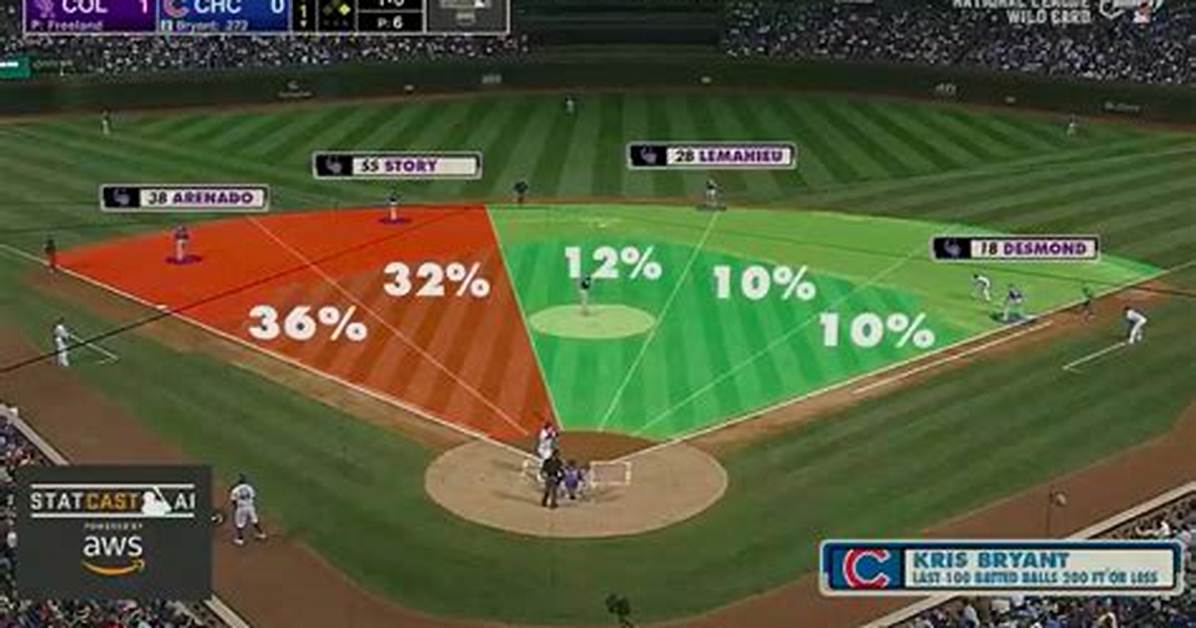
Baseball analysis once treated a bloop hit over an infielder's head the same as a 415-foot blast off the center-field wall. Both registered as a hit in the morning paper. Statcast dismantles that equivalence by calculating expected batting average (xBA) and expected weighted on-base average (xwOBA). These predictive metrics strip defensive alignment and park factors out of the equation.
Every time a batter makes contact, the tracking system measures two core variables: exit velocity and launch angle. The system checks historical hit outcomes for thousands of balls struck with that exact combination of speed and trajectory. If an identical batted ball falls safely 75% of the time across the league, the batter receives an xBA credit of .750 for that swing, regardless of whether the opposing shortstop makes a leaping grab or lets the ball skip into left field.
Looking at a sabermetrics leaderboard reveals sharp divergences between actual output and underlying quality. Hitters with an xwOBA sitting 40 to 60 points higher than their actual wOBA routinely experience offensive explosions once positive regression takes hold. Conversely, hitters maintaining high batting averages while posting subterranean hard-hit rates inevitably collapse back to league average when defensive positioning adjusts.
Maya is a hardware enthusiast who tests and reviews smart home devices, smartphones, wearables, and audio gear. She focuses on practical consumer value and build quality.
